
Service Assurance
Find the broken line before the customer calls.
Your BNG already sees every retransmitted TCP segment that crosses it. That evidence tells you which subscribers are losing packets and which complaints are something else entirely. This release turns it into a work list — and tells you plainly how much of each subscriber's traffic the verdict actually rests on.
lost, continuously
rests on, in 50 minutes
same box, same window
about it
A subscriber was losing roughly one packet in three, for hours, on a live production BNG. Nothing on the box was reporting it. Nobody had called.
bngxdpd now tracks per-subscriber retransmission and packet-reordering rates over time, and raises a fault only when a line stays bad across many independent measurement windows. Each fault is classified as loss or reorder — a distinction that decides whether the problem is lost packets or a path that reorders them. It runs entirely inside the existing telemetry pass: no new packet processing, no new memory structures, and it never changes, drops, or reprioritises a single packet.
The subscriber nobody knew about
These are readings from one live BNG carrying 6,898 subscribers. The same subscriber was measured three times, over three independent windows:
| Measurement window | Retransmit rate | Evidence |
|---|---|---|
| 24-hour cumulative | 29.52% | since box start |
| 13-minute window | 30.61% | 21,165,146 segments |
| 50-minute window | 30.96% | 50,049,727 segments |
| Fleet median, same box | 0.50% | 518 active subscribers |
Three windows, three matching numbers, fifty million packets. This is not a sampling artefact or a bad minute — it is a line that is continuously broken and has been for as long as the box has been counting. That customer is living with unusable video calls and stalling downloads. Either they have given up complaining, or they are about to churn.
A second subscriber was caught degrading in real time. Its 24-hour average was 15.56%, but its live rate had climbed to 47.97%. The average was hiding an active failure — the line broke recently and is getting worse. A trend detector catches that; a cumulative counter never will.
Why conventional monitoring cannot see this
This is the part that surprises people. Anomaly detection — the standard approach, and one this platform already ships — compares each subscriber against their own recent history and alerts on deviation. It is genuinely good at catching the moment something breaks.
But a line that has been broken for a week has a broken baseline. It is not deviating from anything. The worse the fault, and the longer it has been there, the more normal it looks.
Anomaly detection finds change. A standing fault is the absence of change. That is why the worst subscriber on a box can be invisible to every dashboard while a mildly congested one lights up. Proactive line-fault detection is deliberately built the other way round: it measures against an absolute bar, and it requires the fault to persist.
Absolute, not relative
Judged against a loss threshold you set, not against the subscriber's own history — so a permanently broken line cannot normalise itself out of the report.
Persistent, not instantaneous
A fault must stay bad across many qualifying windows before it is raised, and must stay good for twice as long before it clears. A flapping line stays on the list.
Classified, not just ranked
Every fault carries a cause signature that tells you who to send — or whether to send anyone at all.
The expensive question: is it the line, or is it you?
Packet loss and packet reordering both make TCP retransmit. Counted naively they look identical — a subscriber with "high loss". They have completely different causes, and completely different fixes.
kind = loss
Packets are sent and never arrive.
Cause is physical, at or near the customer: damaged copper or fibre, a dirty or corroded connector, a failing ONT or CPE, RF ingress on coax, a marginal DSL pair, a bad drop cable.
Action: roll a truck. It will find something.
kind = reorder
Packets do arrive — out of order. The receiver sends duplicate acknowledgements and the sender retransmits data that was never actually lost.
Cause is in your network: per-packet load balancing, a mismatched LAG or bond hash, an asymmetric or flapping route, an unequal-cost path.
Action: fix the path. Rolling a truck finds a perfect line.
On the box measured above, of the subscribers that would be flagged, a substantial share carried the reorder signature — high retransmits with high out-of-order counts. Every one of those is a technician visit that would have been closed as "no fault found", while the real problem stayed in the network, affecting everyone on that path.
This is where the money is. The industry's most expensive support outcome is not the hard failure — it is the repeat visit that finds nothing wrong. Separating loss from reorder before dispatch turns a category of no-fault-found visits into a routing change made from the NOC.
What it costs to run
Assurance features usually mean more probes, more polling, and a slower box. This one adds none of that, because the data was already being collected for other purposes.
| Concern | Impact |
|---|---|
| Extra packet processing | None. The datapath is unchanged. Detection runs in the management process. |
| Extra telemetry passes | None. It rides the existing per-subscriber pass; the only new work is reading one counter that already sits in the same cache line. |
| New memory structures | None. No new datapath tables at any subscriber scale. |
| Effect on subscriber traffic | None. Observe-only: it never marks, drops, reprioritises or rate-limits a packet. |
| Active testing | None. No synthetic probes, no test calls, no injected traffic. It reads the customer's own real traffic. |
| Default state | Off. Enabled with a single configuration key, applied without restarting the datapath. |
What the operator sees
$ bngxdpctl lines

Line-fault detection: observe
  subscribers tracked   : 6898
  judgeable this tick   : 518    (the rest had too little traffic to score)
  faults OPEN           : 57     (loss 21, reorder 26, mixed 10)
  opened / cleared      : 63 / 6 since daemon start

      interface        kind     severity    loss%  reorder%       open     segments
  !!  vlan904.5142     loss     critical   47.97%     2.08%     1h03m       223255
  !!  vlan812.3501     loss     critical   30.96%     0.05%     4h12m     50049727
  !!  vlan811.7412     reorder  critical   22.85%    14.06%     2h47m        51355
  !   vlan807.5735     reorder  major      17.06%    10.00%     0h51m       305272
An idle line is not a healthy line. A measurement window carrying too little traffic to judge is discarded, not counted as good. It sounds like a detail; it is the difference between a report you can trust and one you cannot. Without it, a subscriber with a badly broken line who goes to bed would quietly clear his own fault overnight, and the list would be empty every morning for the worst possible reason.
It is also why judgeable this tick is far smaller than subscribers tracked. Most subscribers are not moving enough traffic at any given moment to be scored. They are idle, not healthy, and the report says so rather than guessing.
severity is an absolute band, so the same word means the same thing on every gateway: critical at 20% or worse, major from 10%, minor from 5%. Sorted worst first.
Every row has already survived the persistence test, so the list is a work queue rather than an
alert stream. open shows how long the fault has been continuously present — when that
reads 4h12m, the fault did not start when the customer called. segments shows
how much traffic the verdict rests on, so you can tell a strong verdict from a thin one at a glance.
The same data is available as structured JSON for your NOC, ticketing or field-dispatch system, so a classified fault can open a work order automatically, with the cause signature already attached.
In NOC2, on the subscriber
A list of faulty interfaces is useful to a network engineer. It is not much use to the person answering the phone, who has a name in front of them and sixty seconds to decide what to say. NOC2 attaches the verdict to the subscriber, so the fault is already on screen when the call is picked up.
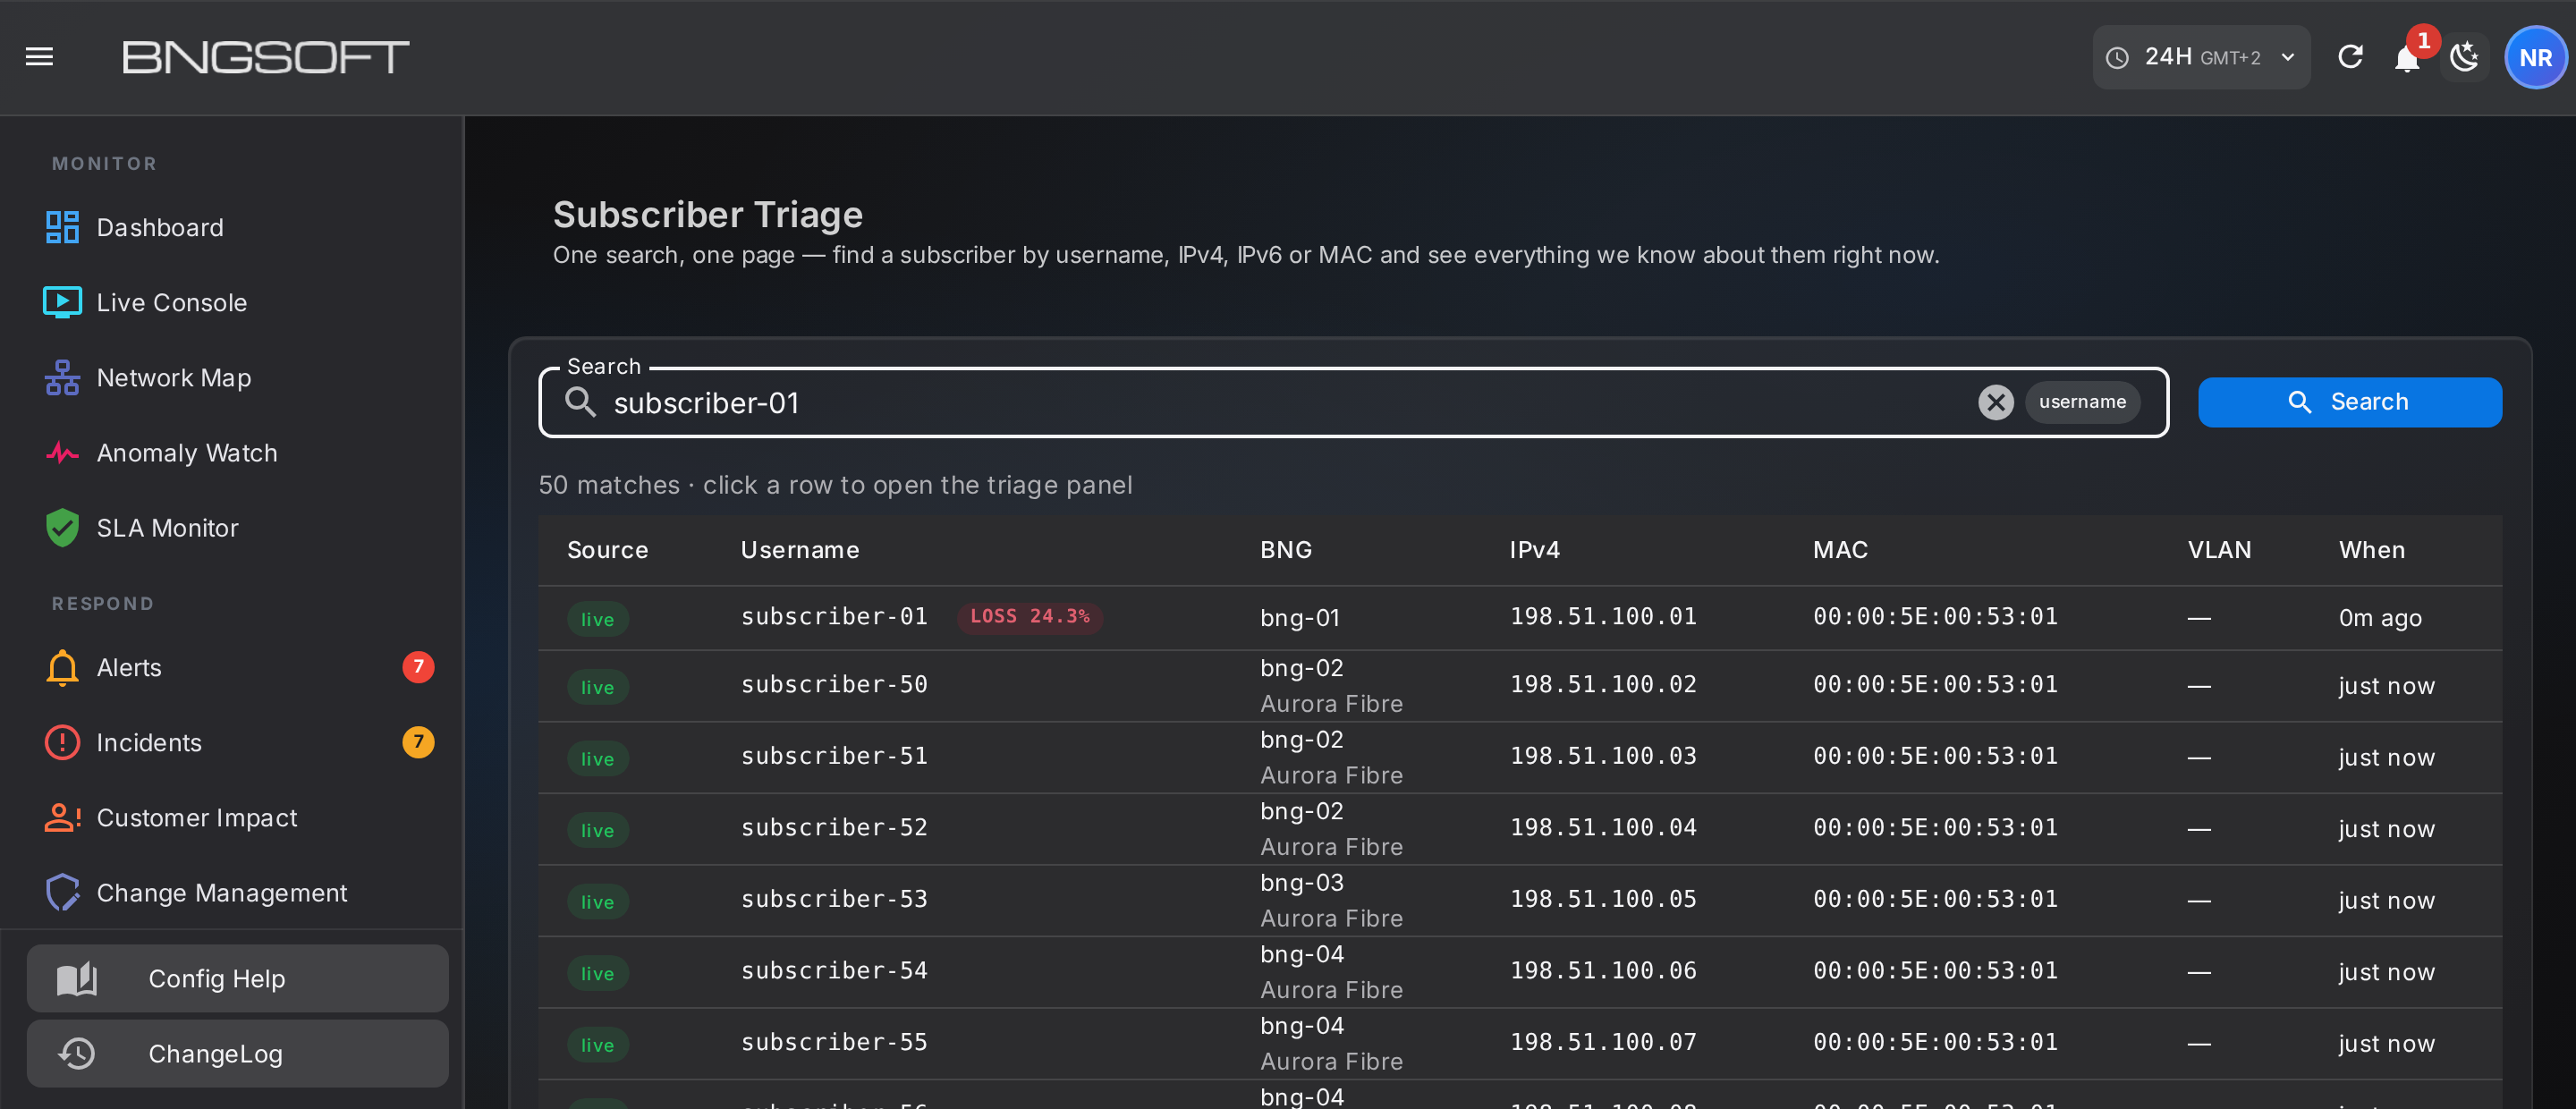
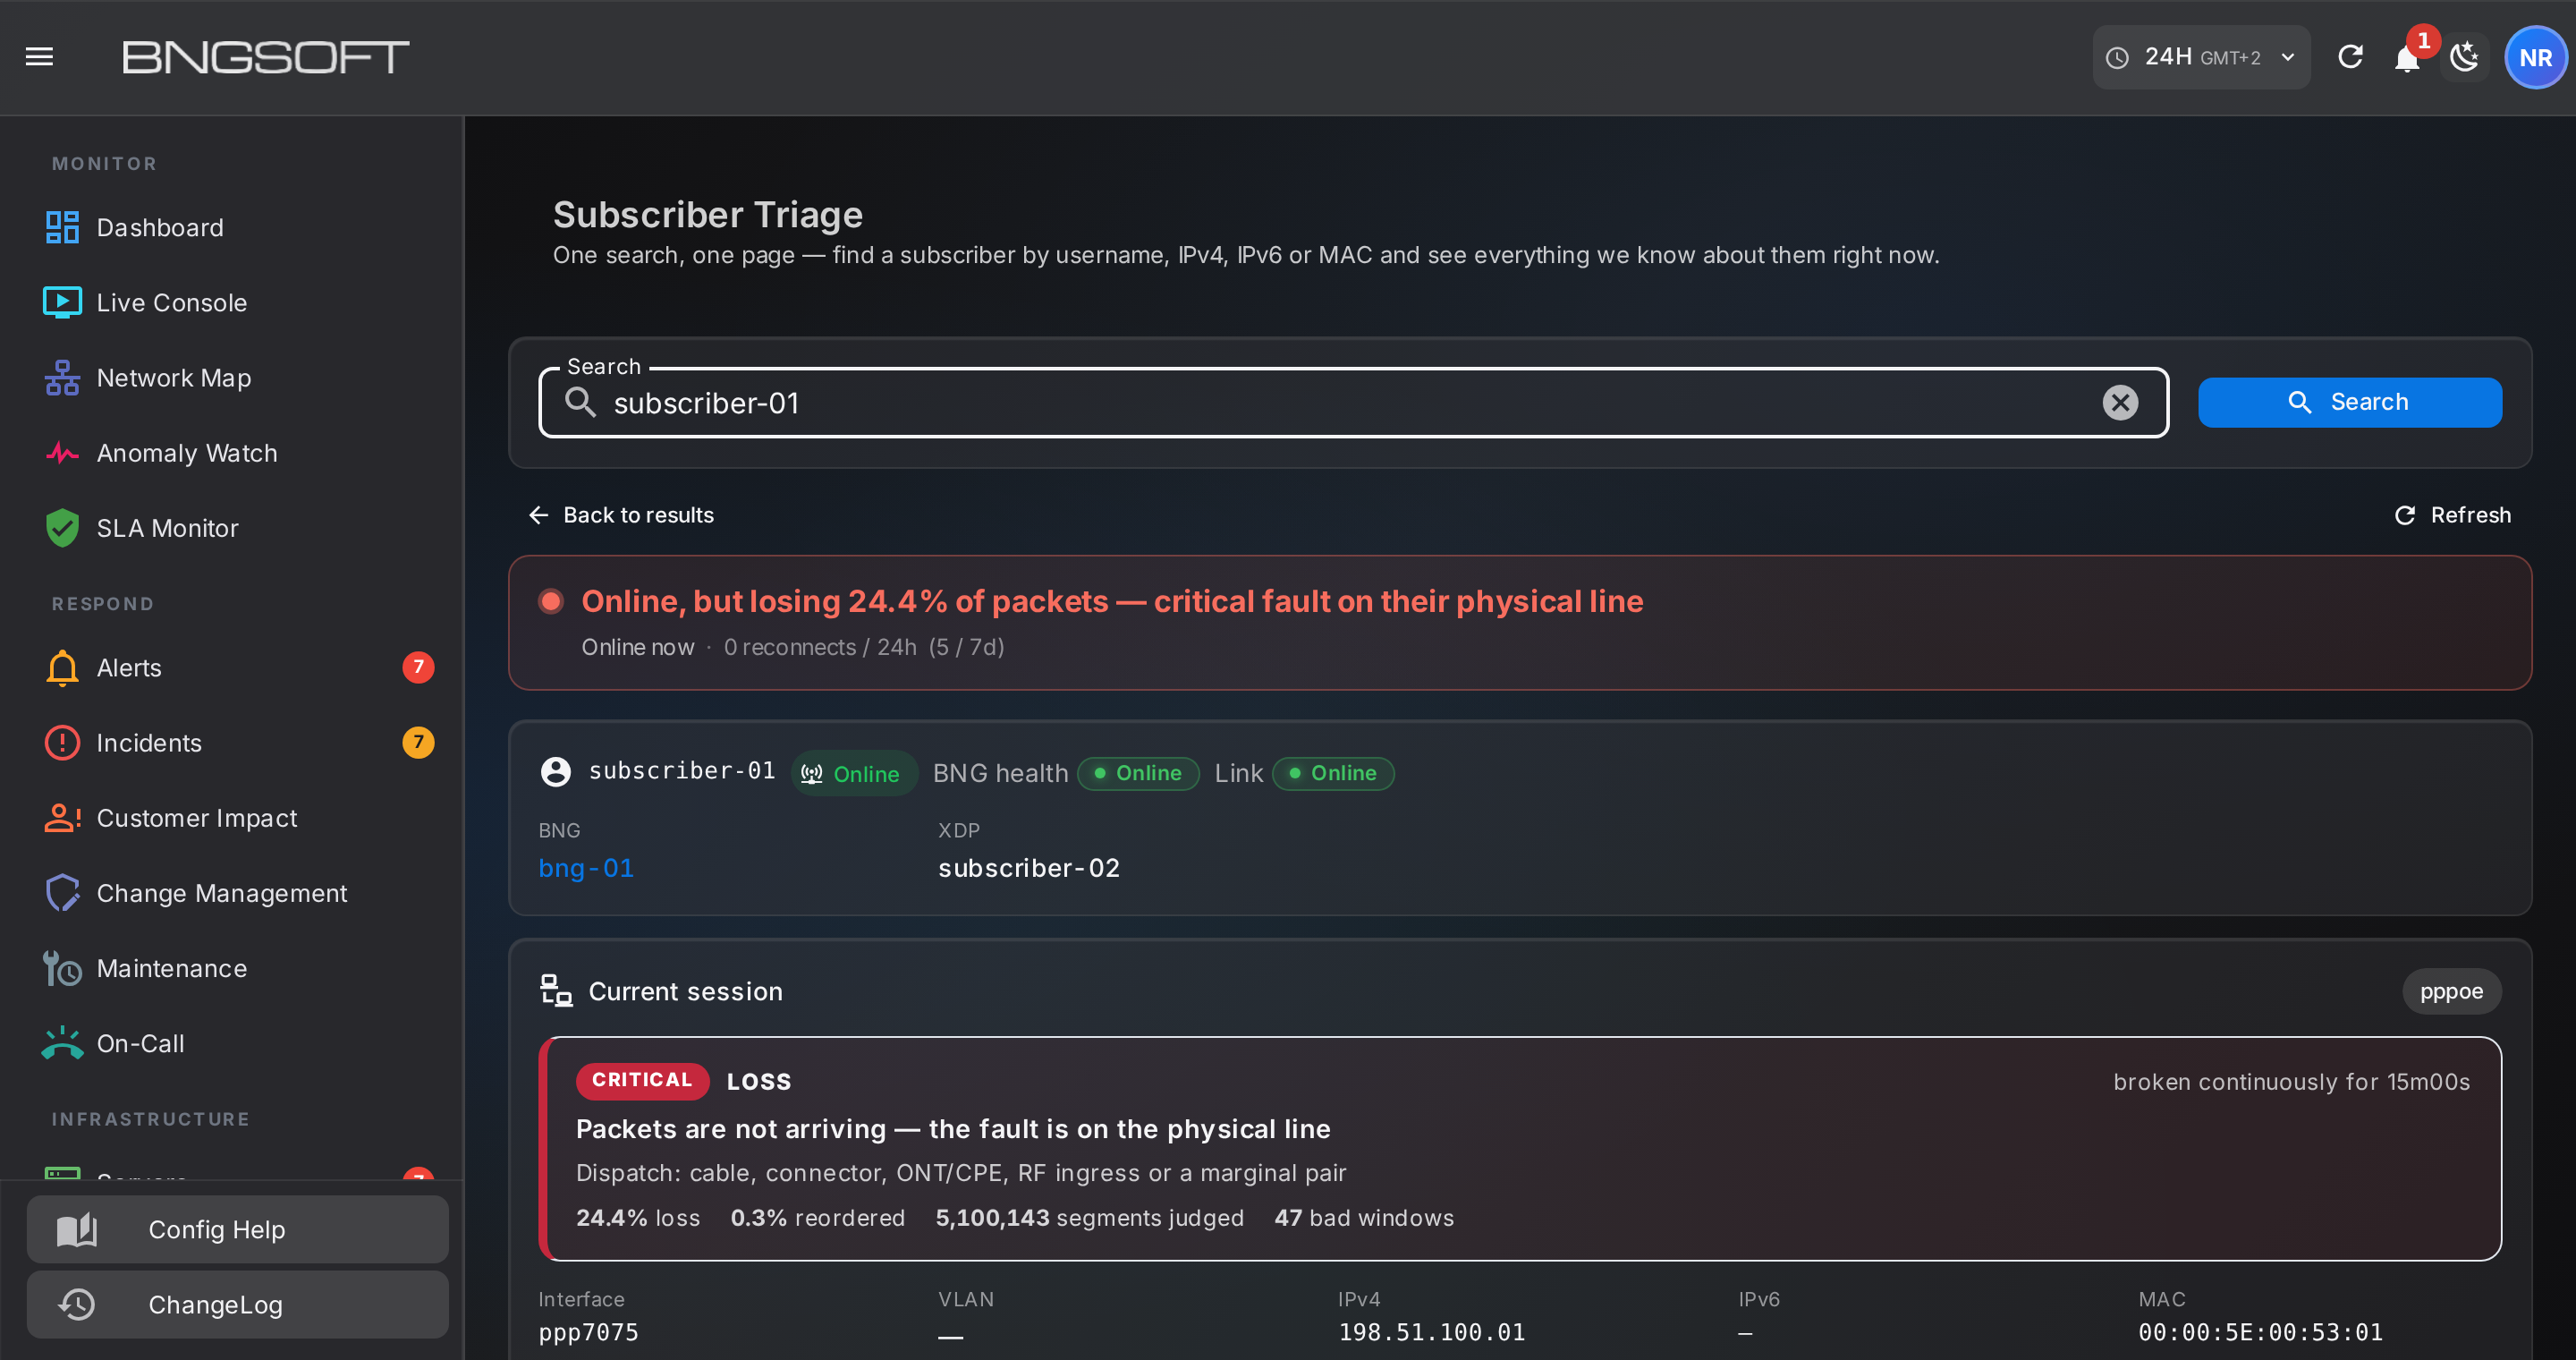
The headline agrees with the banner. A subscriber's summary used to read "Online, stable, BNG healthy" whenever their session was up — which was true of the gateway and wrong about the customer. It now reads "Online, but losing 24.4% of packets on the path — critical, not yet localised". A green tick above a critical fault is how operators learn to stop reading the summary.
It stops short of naming the customer's line, and that restraint is deliberate: the measurement is taken in transit, and on most flagged subscribers there is no access-leg sample behind it. Saying "physical line" would be naming a location the evidence does not reach.
Nothing here is a second measurement. It is the same verdict the daemon reached, carried to where the decision is actually made. A gateway too old to run the detector reports nothing and NOC2 shows nothing — never a reassuring tick it has no evidence for.
Where it changes the operation
Call the customer first
The list is available before anyone complains. Contacting a subscriber about a fault they have not yet reported changes the relationship from apology to service — and it is the single most effective churn intervention most operators have.
Dispatch with a cause, not a symptom
The technician arrives knowing it is a physical fault, not a "slow internet" ticket. Reorder faults never generate a visit at all.
Close the unclosable ticket
The recurring complaint that always tests clean is usually reorder or an intermittent line. Both are now visible with a duration attached.
Prove the fix
Faults clear on sustained recovery and the clear is logged with the fault's lifetime rate — evidence the repair worked, not just that someone attended.
Working the numbers for your own network. The economics come from three inputs only you have: your cost per truck roll, your share of visits currently closed as no-fault-found, and your churn cost per subscriber. On the box measured here, 11% of actively transferring subscribers were above a 5% sustained-loss bar, and roughly half of those carried the reorder signature. Apply your own rates to those two proportions — we would rather you did that than quote you a saving we invented.
Tuning it to your fleet
The loss bar is configurable, and the right setting is an operational choice, not a technical one. A lower bar finds more real faults but produces a longer list; a higher bar produces a list that gets worked.
| Setting | On the measured box | Use when |
|---|---|---|
| 10% sustained | a short list, dominated by critical faults | Starting out. Build confidence, clear the worst, prove the process. |
| 5% sustained (default) | 57 of 518 active subscribers | Steady state, once the critical backlog is cleared. |
| Minimum traffic gate | tunable | Controls how much real traffic a subscriber must pass before they can be judged at all. |
A subscriber who is idle is never scored. A window without enough traffic to support a ratio is discarded rather than counted as healthy — so a quiet night cannot silently clear a real fault, and a customer who barely uses their connection is never flagged on thin evidence.
How to evaluate it
Turn it on in observe mode on one BNG and leave it for a day. It changes nothing about how traffic is handled, so there is no risk window and no maintenance change. Then take the top ten faults and check them against your ticket history. The question that matters is simple:
How many of these subscribers were already having a bad experience — and how many of them had told you?